Loam-Series Evaluation
Introduction
In this project, we systematically examined and compared various algorithms within the LOAM series, specifically ALOAM, LEGO-LOAM, and SC-LEGO-LOAM. Our primary focus was on meticulously analyzing the developmental trajectory from a singular lidar odometry approach (the original LOAM) to the comprehensive SLAM systems, namely Lego- LOAM and SC-LEGO-LOAM. This comprehensive analysis involved intricate comparisons between algorithms, elucidation of improvements made, and in-depth assessments. Ultimately, we conducted thorough testing and comparison of these three algorithms on two extensive long-distance datasets
Evaluation and Metrics
Table 1: ATE of LeGO-LOAM and SC-LeGO-LOAM in Kaist sequence {{< math >}}
$$ \begin{array}{|l|c|c|} \hline \textbf{Metric} & \textbf{SC-LeGO-LOAM (\%)} & \textbf{LeGO-LOAM (\%)} \\ \hline \text{max} & 1.60 & 2.55 \\ \hline \text{mean} & 0.84 & 1.03 \\ \hline \text{median} & 0.82 & 1.01 \\ \hline \text{min} & 0.08 & 1.35 \\ \hline \text{rmse} & 0.90 & 1.13 \\ \hline \end{array} $${{< math >}}
Table 2: ATE of LeGO-LOAM and SC-LeGO-LOAM in Riverside sequence {{< math >}}
$$ \begin{array}{|l|c|c|} \hline \textbf{Metric} & \textbf{SC-LeGO-LOAM (\%)} & \textbf{LeGO-LOAM (\%)} \\ \hline \text{max} & 2.89 & 8.55 \\ \hline \text{mean} & 1.35 & 2.82 \\ \hline \text{median} & 1.36 & 3.34 \\ \hline \text{min} & 0.20 & 0.27 \\ \hline \text{rmse} & 1.46 & 3.34 \\ \hline \end{array} $${{< math >}}
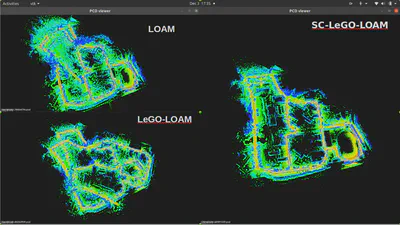
Output
Map Here are the map formed by the LOAM Algorithm on the MulRAN Dataset(KAIST track):